1
2
3
4
5
6
7
8
9
10
11
12
13
14
15
16
17
18
19
20
21
22
23
24
25
26
27
28
29
30
31
32
33
34
35
36
37
38
39
40
41
42
43
44
45
46
47
48
49
50
51
52
53
54
55
56
57
58
59
60
61
62
63
64
65
66
67
68
69
70
71
72
73
74
75
76
77
78
79
80
81
|
import echarts from "echarts";
export function genEcharts1(el, data) {
const echartsIns = echarts.init(el);
const option = {
xAxis: {
type: "category",
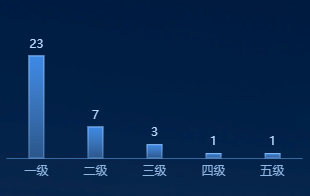
data: ["一级", "二级", "三级", "四级", "五级"],
axisTick: {
show: false,
},
axisLabel: {
color: "#90B6E2",
},
axisLine: {
lineStyle: {
color: "#3868A0",
},
},
},
yAxis: {
show: false,
type: "value",
},
series: [
{
data,
type: "bar",
barWidth: 15,
label: {
show: true,
position: "top",
color: "#BADAFF",
},
itemStyle: {
borderWidth: 1,
borderColor: new echarts.graphic.LinearGradient(0, 0, 0, 1, [
{
offset: 0,
color: "#8DC0FD",
},
{
offset: 1,
color: "#8DC0FD88",
},
]),
color: new echarts.graphic.LinearGradient(0, 0, 0, 1, [
{
offset: 0,
color: "#3D8AE7",
},
{
offset: 1,
color: "rgba(98,160,234,0.4)",
},
]),
},
},
],
};
echartsIns.setOption(option);
return echartsIns;
}
const data = [120, 200, 150, 80, 70];
const el = document.getElementById("echarts1");
genEcharts1(el, data);
|